30 10/15
21:55

Adding Contour Lines in Google Earth

It took me the better part of a day to figure this out, so I thought I would write down the steps…

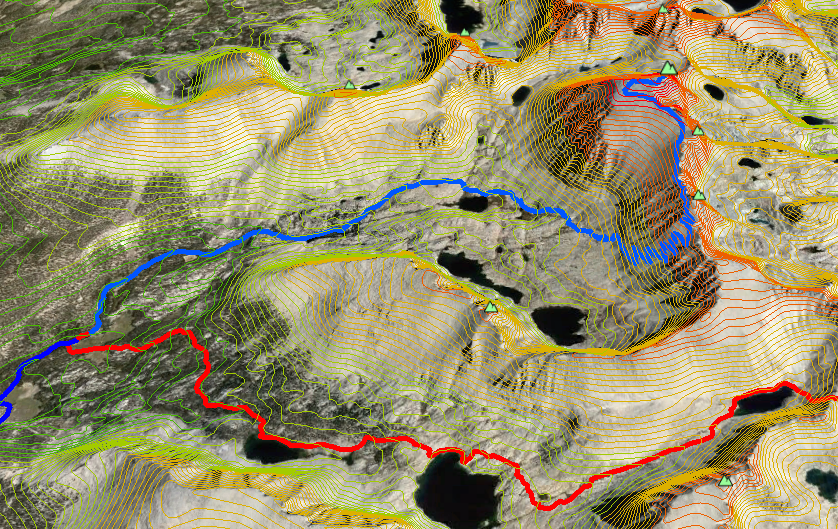
The Goal:WhitneyContours


First we need the contour data:

  1. Data comes from this excellent site (US Only):  http://viewer.nationalmap.gov/viewer/
  2. Zoom in on your area of interest
  3. Click “Download Data” in upper right corner of screen
  4. Select the first option to “Click here to draw and download by Bounding Box”
  5. Drag a rectangle that covers the area of interest
  6. Select “Contours” in the dialog and click Next
  7. You will be presented with a list the available products covering the selected area
  8. Select the Shapefile covering your are of interest
    1. The data we are looking for is “USGS NED 1/3 arc-second Contours” in the Shapefile format
    2. If you’re lucky, you will have just one Shapefile that covers your area
  9. The shopping Cart will open on the left side of the screen
  10. Click on the item and it will be listed in the bottom portion of the screen
  11. Then click on the “Download” option and save the file to your PC
    1. Note:  These can be very big files…
  12. Extract the zip file into its own folder (shapefiles are actually a collection of separate files)

Not as difficult as it sounds.  Here is a video…

Moving on to the Google Earth part…  Download and install Google Earth Pro – Which is now free!!

  • Open Google Earth and go to the location of interest
  • Figure out the highest and lowest points of interest and write down the altitude value for later
  • Set the view in Google Earth to just the area you are interested in – Top down view is good
  • Do File>Import
  • Change the file type to ESRI Shape (.shp), find and select your shape file.
    • Depending on the size of the shape file, it could take a while to process.  This is a lot of data!
  • Then you get to select what to import – Select Restrict to View (or All if you are patient)
    • Again, this will take some time…
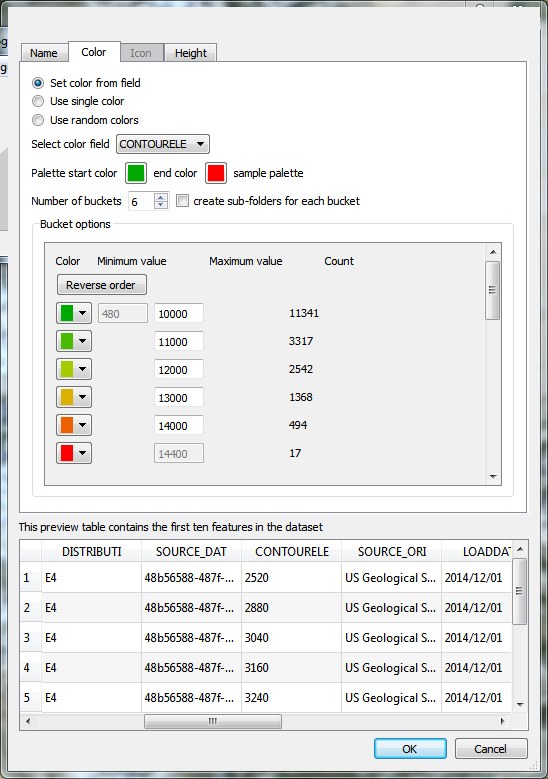
  • Say Yes to the Contour Template prompt and you will end up at a dialog as shown below – select the color Tab
  • This dialog is a little funky (IMHO) – it took me a few tries to get it set up
    • Select “Set color from Field” and select “CONTOURELE” as the field of interest
    • Then it is just your particular tastes to set up a range of colors between your highest and lowest points
  • Once you are happy, click OK – GE will ask if you want to save the template – you do
  • Then wait again…  When it is done thinking, you can turn on the contours in your temporary places folder

ContourFilter


QED…

30 10/15
17:45

A Very Simple Raspberry Pi Clock Using Adafruit 16×2 LCD Pi Plate

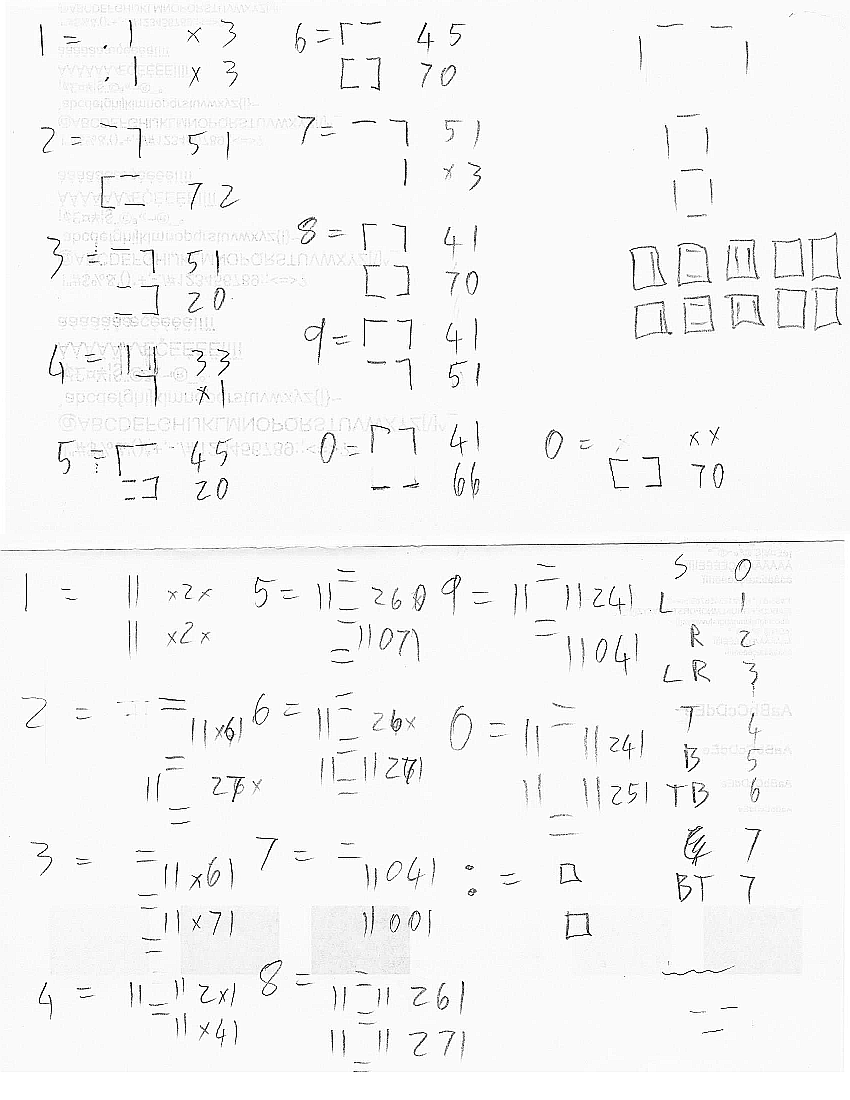
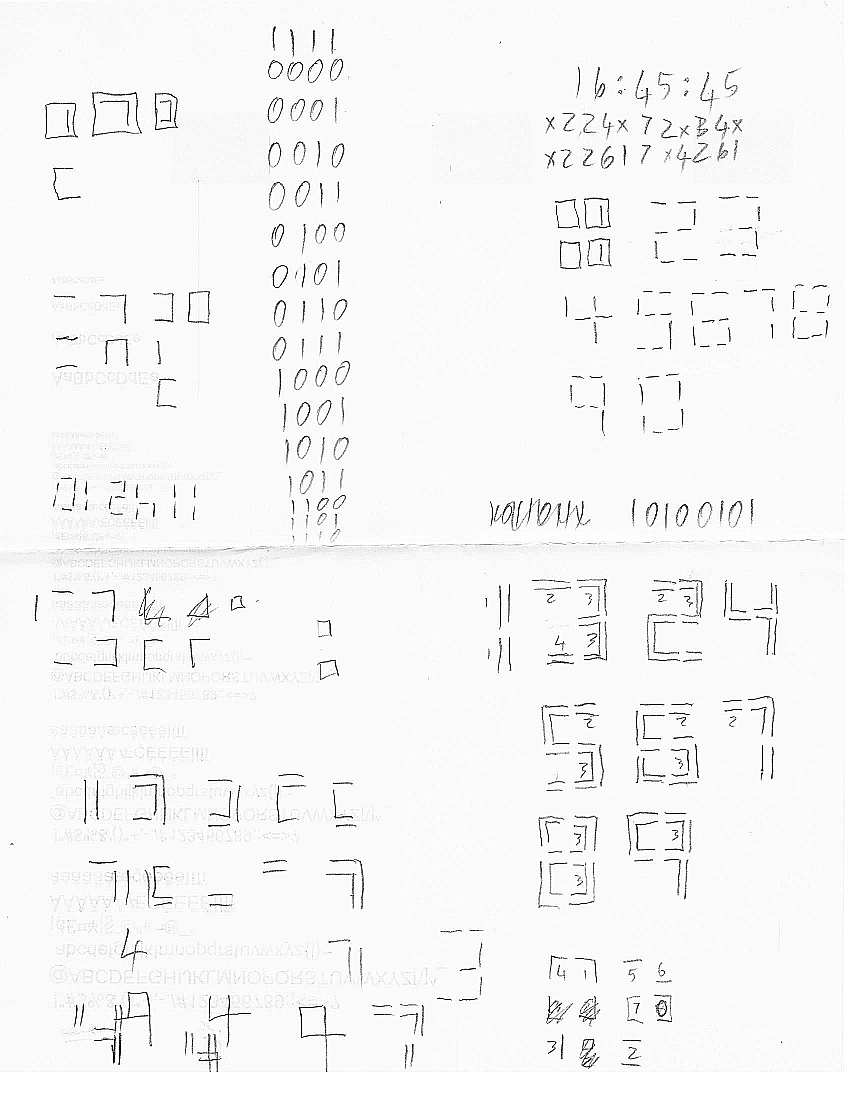
I had a spare Raspberry Pi and Pi Plate sitting around so I decided to make yet another clock. The trick to this is that I wanted to make a full height display using a 16×2 character LCD. The PiPlate supports defining a few custom characters which I sketched out on a napkin (literally). I am sure this wont make much sense to others, but here it is:

ThoughtProcess2

ThoughtProcess1

After installing the drivers and such per instructions here: https://learn.adafruit.com/adafruit-16×2-character-lcd-plus-keypad-for-raspberry-pi

Raspbian automatically sets up NTP to keep the clock accurate, so the final code is pretty simple:

#!/usr/bin/python
# Simple clock using 16x2 LCD
import math
import time
import sys

import Adafruit_CharLCD as LCD
# Initialize the LCD using the pins
lcd = LCD.Adafruit_CharLCDPlate()
lcd.set_backlight(1)

# Create some custom characters
lcd.create_char(0, [0, 0, 0, 0, 0, 0, 0, 0])
lcd.create_char(1, [16, 24, 24, 24, 24, 24, 24, 16])
lcd.create_char(2, [1, 3, 3, 3, 3, 3, 3, 1])
lcd.create_char(3, [17, 27, 27, 27, 27, 27, 27, 17])
lcd.create_char(4, [31, 31, 0, 0, 0, 0, 0, 0])
lcd.create_char(5, [0, 0, 0, 0, 0, 0, 31, 31])
lcd.create_char(6, [31, 31, 0, 0, 0, 0, 0, 31])
lcd.create_char(7, [31, 0, 0, 0, 0, 0, 31, 31])

# Define digit pairs from 00 to 61 (yes 61 because of leap seconds)
digits=[\
        [24341,25351],[24120,25120],[24161,25370],[24161,25171],[24301,25141],[2
4360,25171],[24360,25371],[24141,25101],[24361,25371],[24341,25141],
        [ 2241, 2251],[ 2020, 2020],[ 2061, 2270],[ 2061, 2071],[ 2201, 2041],[
2260, 2071],[ 2260, 2271],[ 2041, 2001],[ 2261, 2271],[ 2241, 2041],
        [ 6341,27251],[ 6120,27020],[ 6161,27270],[ 6161,27071],[ 6301,27041],[
6360,27071],[ 6360,27271],[ 6141,27001],[ 6361,27271],[ 6341,27041],
        [ 6341, 7351],[ 6120, 7120],[ 6161, 7370],[ 6161, 7171],[ 6301, 7141],[
6360, 7171],[ 6360, 7371],[ 6141, 7101],[ 6361, 7371],[ 6341, 7141],
        [20341, 4351],[20120, 4120],[20161, 4370],[20161, 4171],[20301, 4141],[2
0360, 4171],[20360, 4371],[20141, 4101],[20361, 4371],[20341, 4141],
        [26241, 7351],[26020, 7120],[26061, 7370],[26061, 7171],[26201, 7141],[2
6260, 7171],[26260, 7371],[26041, 7101],[26261, 7371],[26241, 7141],
        [26241,27351],[26020,27120]]

# Loop forever
while True:
        now=time.localtime()
        hrs=int(time.strftime("%H"))
        min=int(time.strftime("%M"))
        sec=int(time.strftime("%S"))

        # Build string representing top and bottom rows
        L1="0"+str(digits[hrs][0]).zfill(5)+str(digits[min][0]).zfill(5)+str(dig
its[sec][0]).zfill(5)
        L2="0"+str(digits[hrs][1]).zfill(5)+str(digits[min][1]).zfill(5)+str(dig
its[sec][1]).zfill(5)

        # Convert strings from digits into pointers tocustom character
        i=0
        XL1=""
        XL2=""
        while i < len(L1):
            XL1=XL1+chr(int(L1[i]))
            XL2=XL2+chr(int(L2[i]))
            i += 1

        # Update Display
        lcd.home()
        lcd.message(XL1+"\n")
        lcd.message(XL2)

        # Wait for next tic
        time.sleep(0.9)
        while now==time.localtime():
                time.sleep(0.01)

The final step is just to make it start on boot which I did by adding the following line to root’s crontab:

@reboot /usr/bin/python /usr/bin/pintp.py